Create an account
Your company receives access to the NovaSets platform and the Scan App environment where the measurement setup is managed.
Want to know whether QuickScan fits your production line, warehouse, or packing process? Set up a short call and we will map the first measurement cycle with you.
QuickScan is not a vague observation exercise. It is a structured measurement flow that your team can use with a QR code sheet, a scanner, and a browser with internet access.
Your company receives access to the NovaSets platform and the Scan App environment where the measurement setup is managed.
You enter the activity definitions that match your real operation, such as sorting, packing, waiting, setup, quality checks, or order handling.
The system generates QR code sheets for the defined activities. The workforce takes these sheets to the work area.
Before and after each physical task, the user scans the relevant QR code. The system registers the duration of each activity.
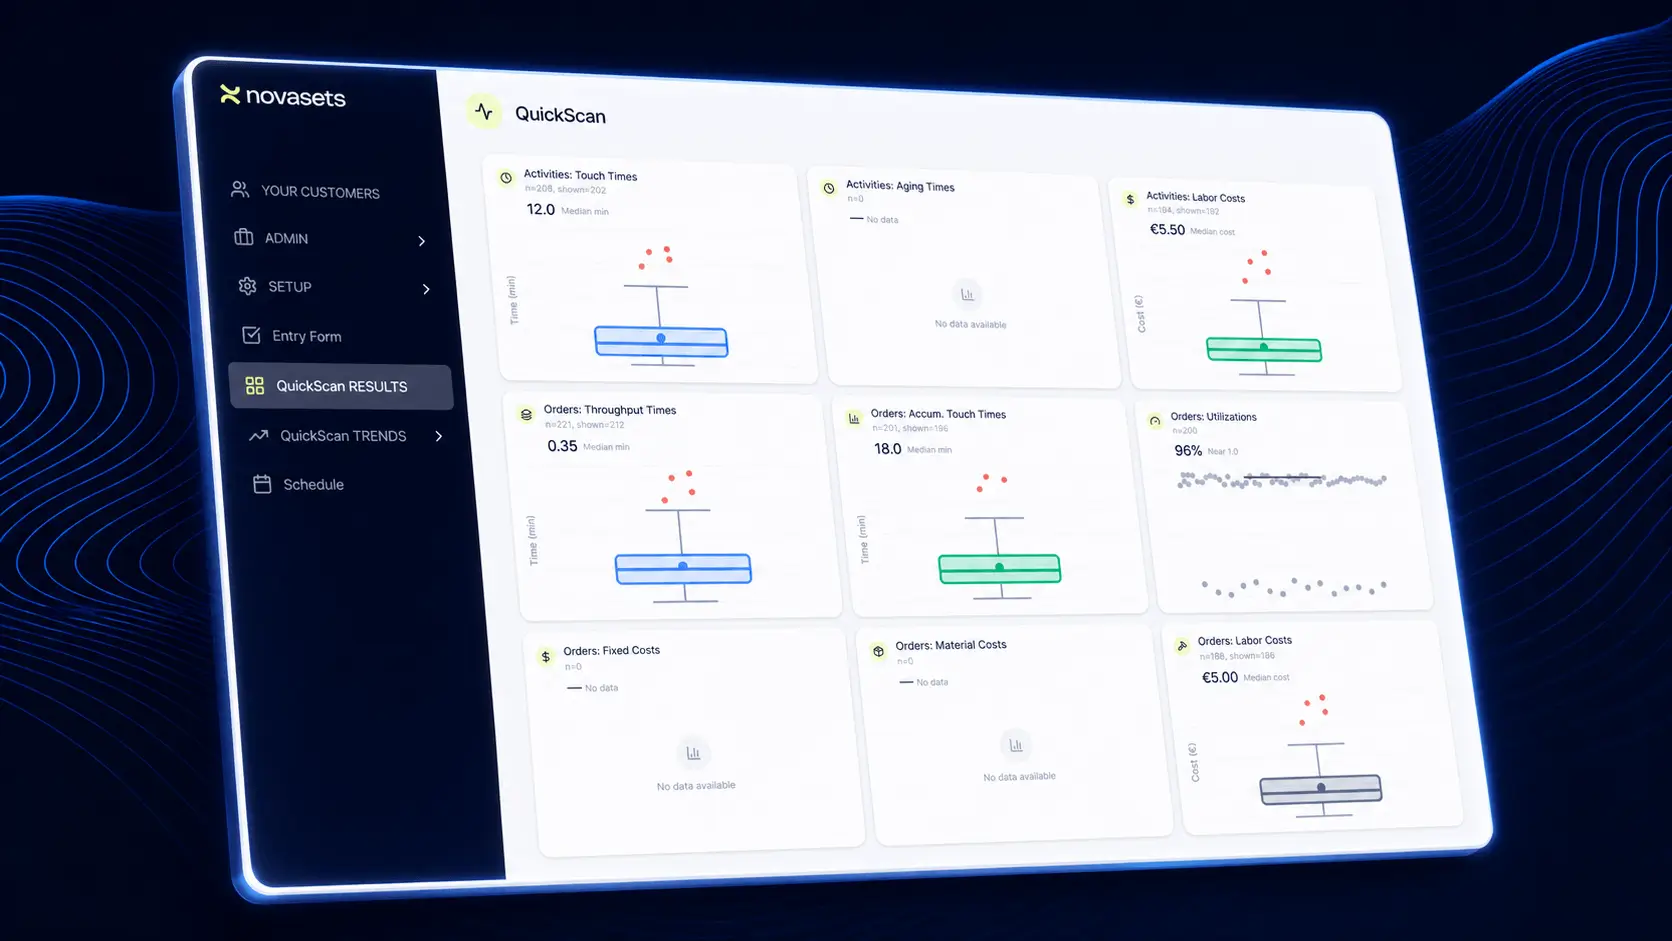
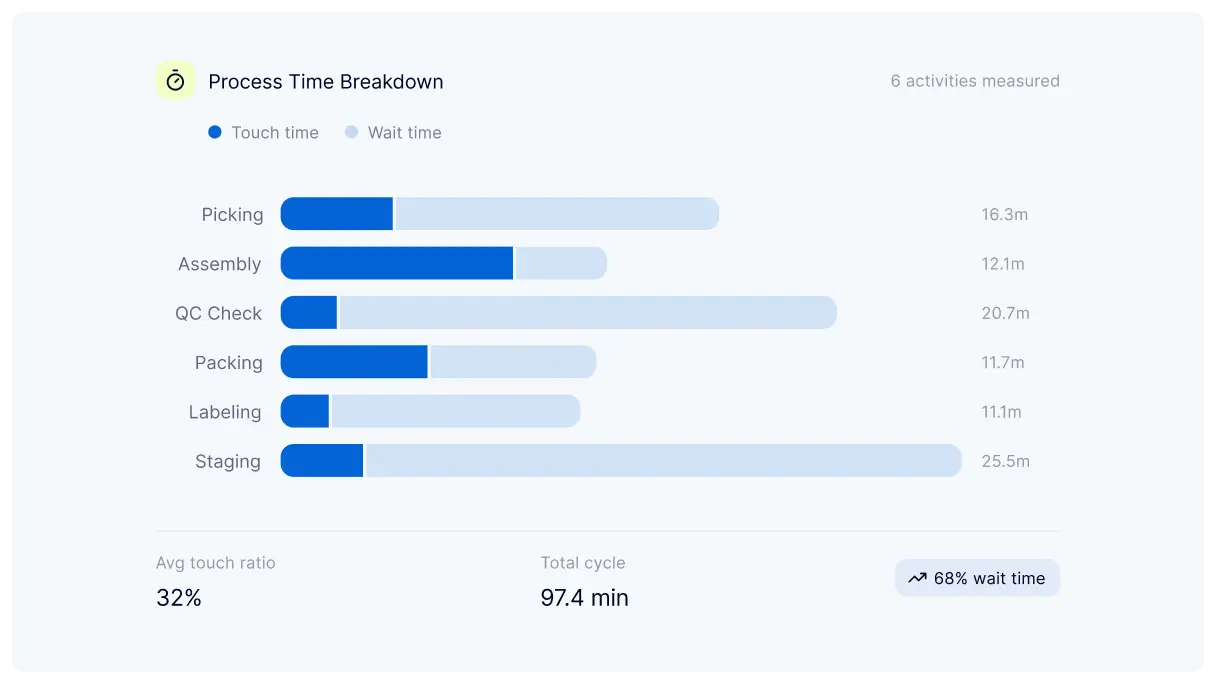
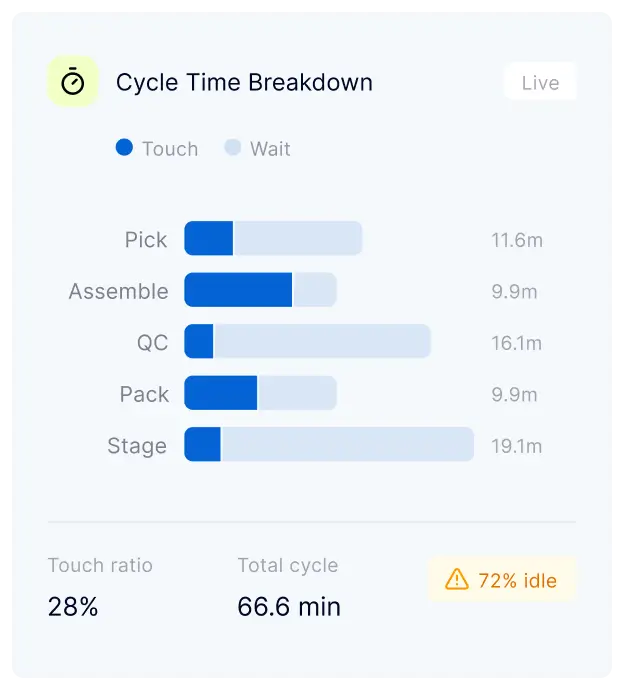
After enough scans have been collected, the platform shows mean, median, spread, outliers, variation, and performance per process step.
After improvement actions are implemented, the process is measured again. The system helps determine whether the change is statistically significant.

People often know where work feels slow, but they rarely have reliable numbers for each activity. Without measured durations, variation, and order-level context, improvement discussions quickly become opinion-based.
QuickScan starts with basic activity scanning and can become more powerful by adding order numbers and cost data. This allows you to understand not only which steps take time, but also which orders, options, or process conditions absorb the most capacity and money.

The method works because it is simple enough for the shop floor and structured enough for serious analysis. Operators only scan what they are doing. The platform turns those scans into performance evidence.
Each scan creates a timestamped activity record. Over time, the system builds a statistical picture of how each process step performs.
Read success storiesYour process definitions determine what the workforce can scan, so the measurement fits the real operation.
A QR sheet, a scanner, and a browser with internet access are enough to start measuring.
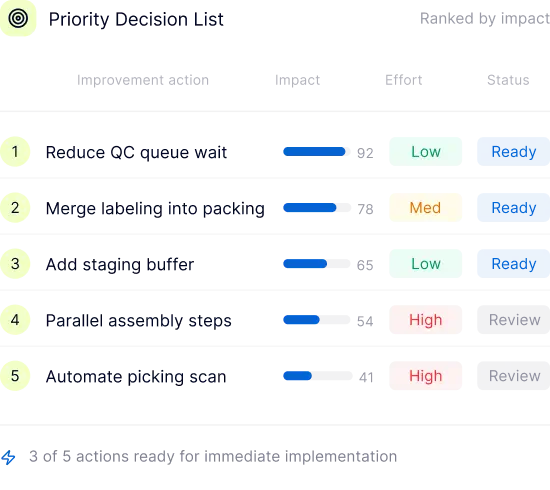
The results show which steps, orders, or cost drivers deserve attention first.
Book a callQuickScan gives you a practical measurement setup and the results needed to act. The goal is not a long report, but a clear direction for improving efficiency.
Your team gets access to the Scan App, process-step definitions, QR code sheets, and a practical workflow for measuring real activity durations.
Set up a call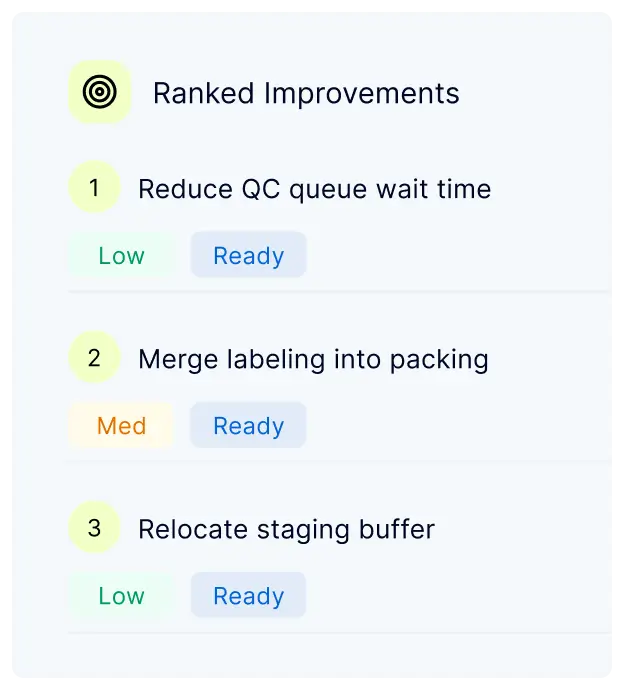
The results pages show activity duration, mean, median, spread, variation, outliers, order-level patterns, and cost impact when cost data is added.
View servicesQuickScan turns floor activity into measurable evidence. Once enough data has been collected, the platform helps identify which steps create delays, which orders absorb capacity, and where improvement work should start.
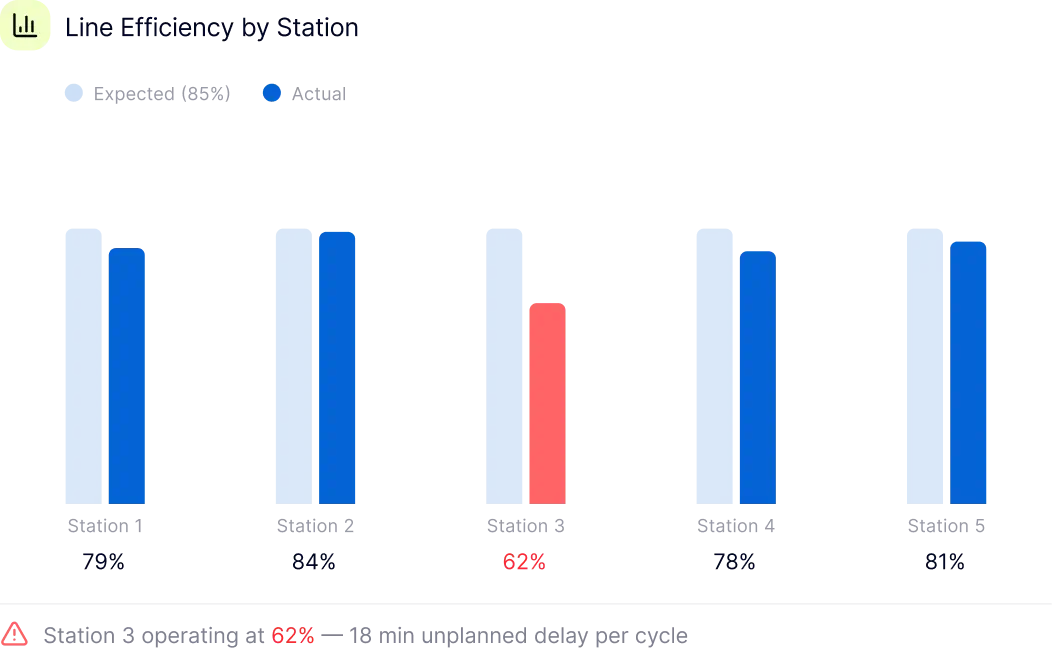
Each activity can be analysed by duration, mean, median, spread, outliers, and variation. This makes it clear which steps are stable and which steps create unpredictable performance.
Clear answers about setup, scanning, data, and what to expect.
You need access to the NovaSets platform, defined process steps, printed QR code sheets, a QR code scanner, and a simple browser with internet access.
The workforce scans the relevant QR codes before and after physical tasks. The scan flow is intentionally simple so it can be used in the work area without complex training.
The system records timestamps and calculates activity durations. After enough data is collected, it shows statistical results such as mean, median, spread, variation, and outliers per process step.
Yes. When users scan order numbers, the platform can connect activity durations to specific orders or order types. This helps reveal how small orders, complex orders, or customer-specific options affect the operation.
Yes. When cost data is added, the analysis can connect operational time and variation to financial impact. This helps prioritize improvements based on both efficiency and cost.
After the improvement project, the measurement can be repeated. The system compares before and after results and helps determine whether the observed change is statistically significant.
No. A QuickScan can start with process definitions, QR sheets, scanning, and a browser. Existing system data can be added later if deeper analysis is needed.
In a short call, we help you determine which process to measure first, which activity definitions are needed, and how the QR scan flow would work on your floor.
We will help you choose the process area, define the first activity list, and prepare the scan flow so your team knows exactly what to do.
Book a discovery call. We will discuss your process, the available data, and whether activity scanning, order scanning, or cost analysis should come first.
Book a call